Intel VTune profiler
VTune is a performance analysis tool from Intel for profiling serial and multithreaded applications. The data collector profiles your application using the OS timer, interrupts a process, collects samples of all active instruction addresses with the sampling interval of 10ms, and captures a call sequence (stack) for each sample. By default, the collector does not gather system-wide performance data but focuses on your application only. Below we describe a setup for Python code analysis only, but it could be used for many other languages etc. Compared to other popular Python profilers like cProfile and Line_profiler it can provide code line-level granularity with minimal overhead. A more detailed comparison can be found here
Getting started
Setting Up VTune
It is assumed that Scipion3 has been previously installed. In the example below we will run “Hotspots” analysis which can show the CPU usage issues.
Activate VTune with e.g. the following script:
source /path/to/vtune/latest/env/vars.sh
export AMPLXE_RUNTOOL_OPTIONS=--no-altstack
Open Vtune (vtune-gui) and create a new project. If the Configure Analysis tab didn’t open, right click on the project name and select that option.
Setup the analysis configuration as below. You need to specify:
full path to scipion3 launcher
application parameters (below we set the config file and the last project to be opened)
extra environment variables (PYTHONUNBUFFERED, SCIPION_HOME and LD_LIBRARY_PATH)
also tick Analyze child processes
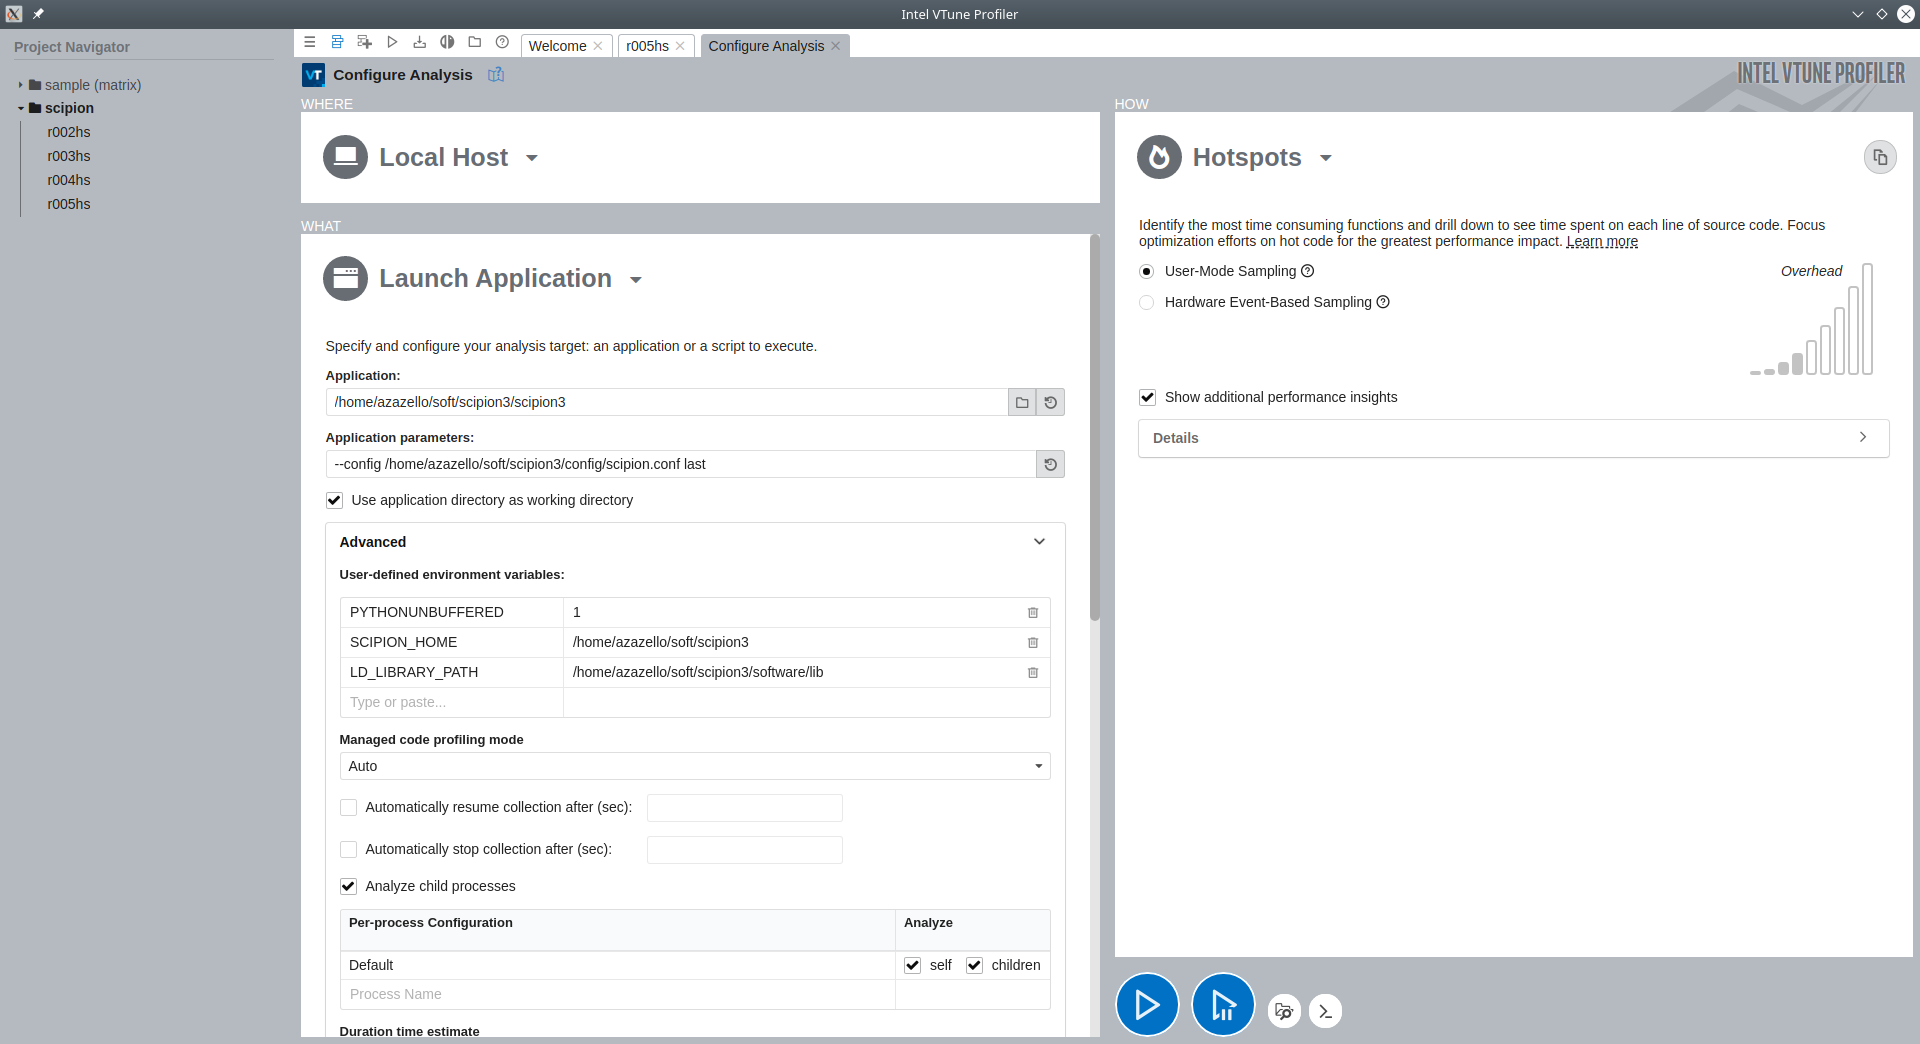
Press big Start button at the bottom. After a while the last Scipion project will open. You are free to chose whether you want to profile project window loading (remove “last” keyword), opening of a project window or running a protocol in the project. Since VTune can analyse child processes it will find the Python and other (e.g. Xmipp etc) processes forked by Scipion.
Once finished, close all Scipion windows. VTune will start processing profiling data.
Warning
You need to close the launched process (Scipion) otherwise the profiler will not complete its job!
Analysing results
In our example below we have Scipion installed via conda and we have run the analysis on an empty project (which we just closed after its opening). The Scipion launcher we provided in the configuration is a small python script executed by system Python. This script in turn sets up conda and activate Scipion environment. Inside that environment we launch Scipion itself (python -m scipion …). Subsequently, Scipion GUI processes and protocol steps execution are run by child processes of the Scipion python. In reality, the situation is even more complicated with more Python and OS threads.
Once the analysis has finished, you will land on the Summary tab with some global statistics. You can see that we mostly used two CPU cores in our little test.
Let’s see how the timeline for the process tree looks like. Go to the Platform tab, choose Process/Thread/Module in the top right menu then right click on any process and sort them by Row Start Time, Ascending.
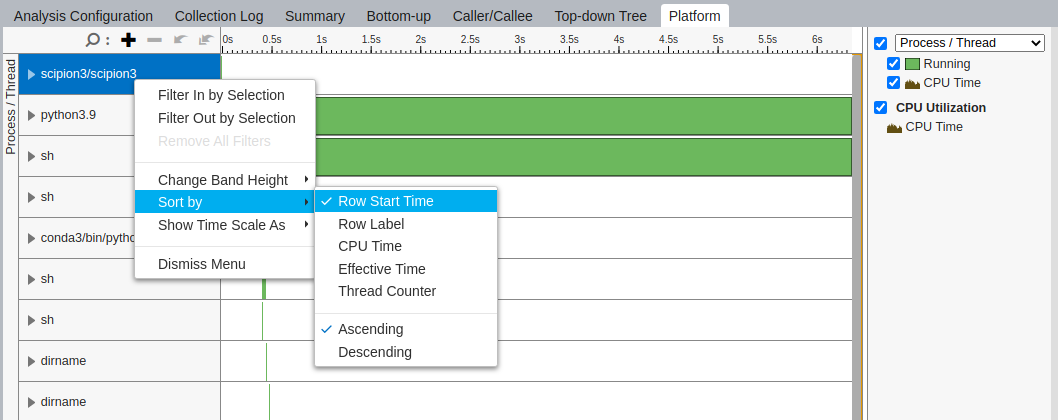
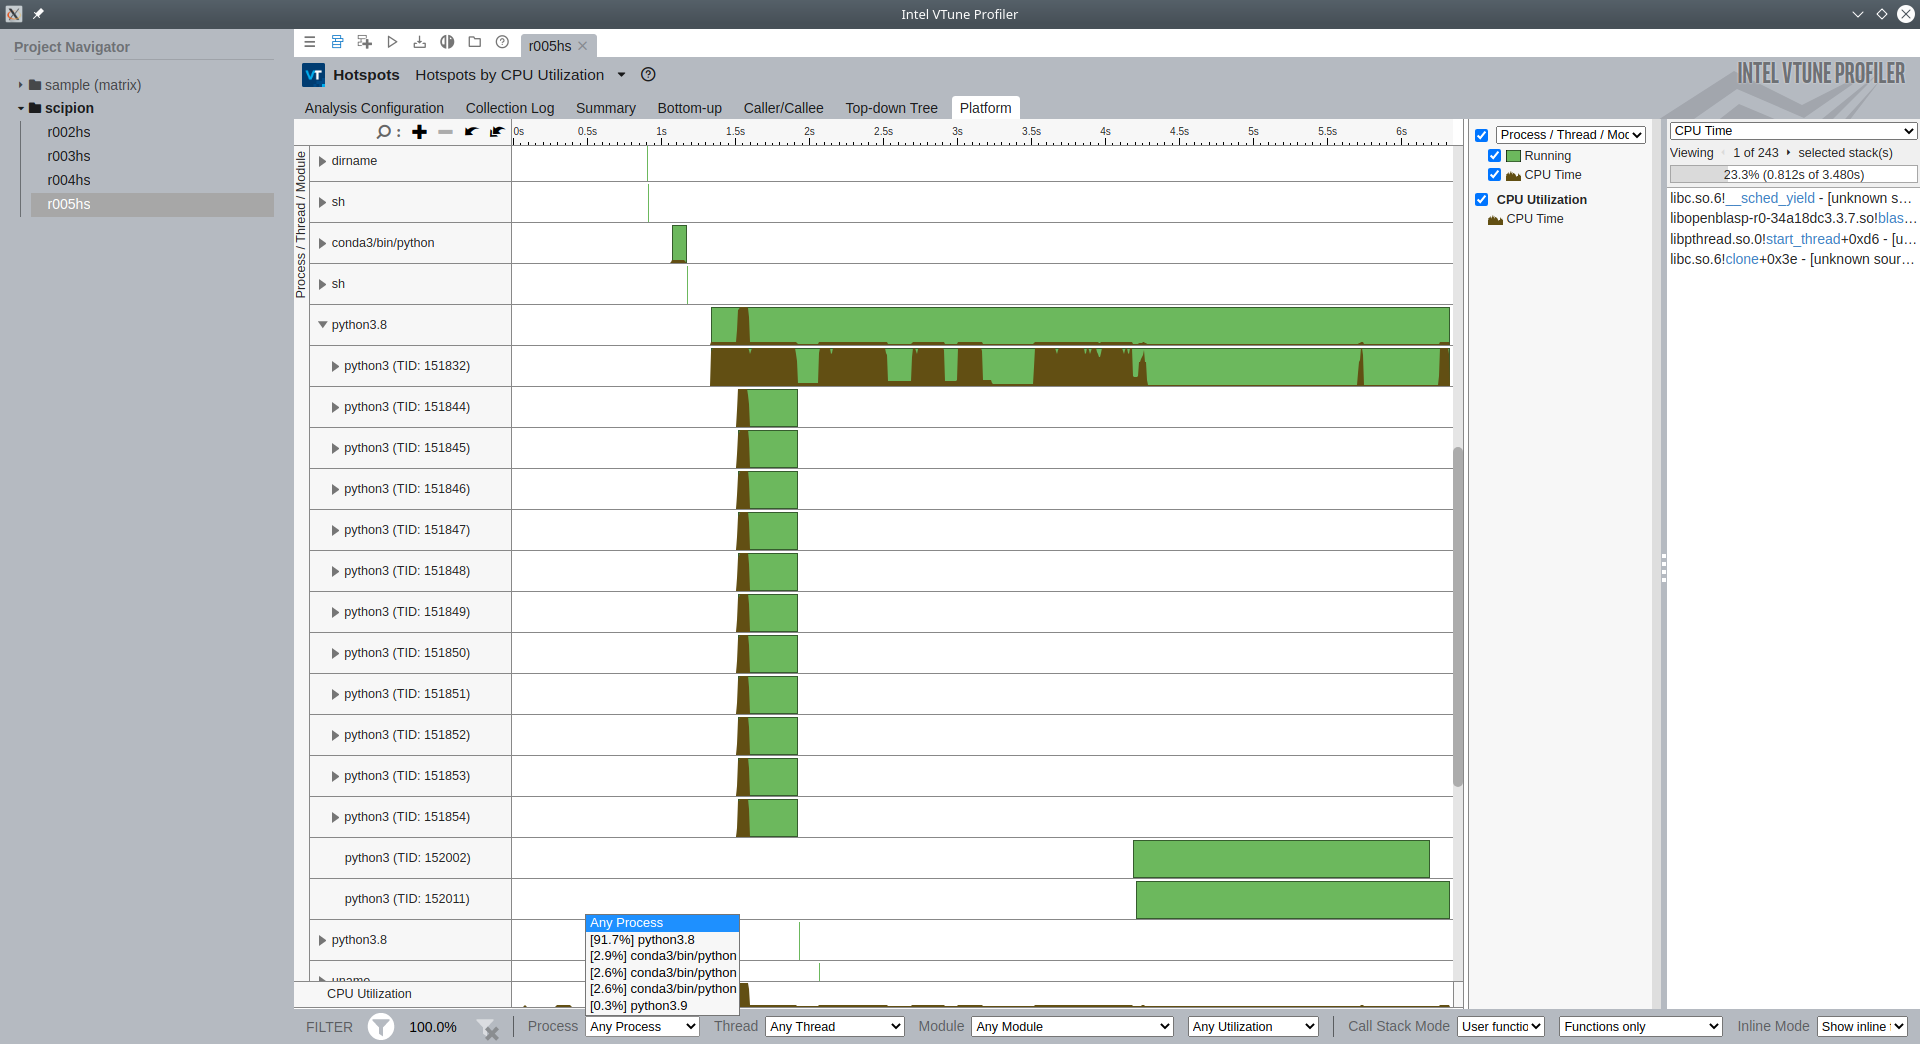
The first in the list is scipion3 launcher script, followed by python3.9 (our system python). Scroll down and you will see conda’s python getting initialized, followed by python3.8. The last process is the Scipion python (from Scipion’s conda environment), that has several child threads for GUI etc.
You can also choose at the bottom which process and/or threads events/calls to show:
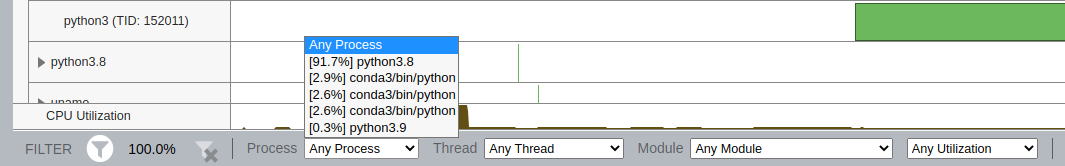
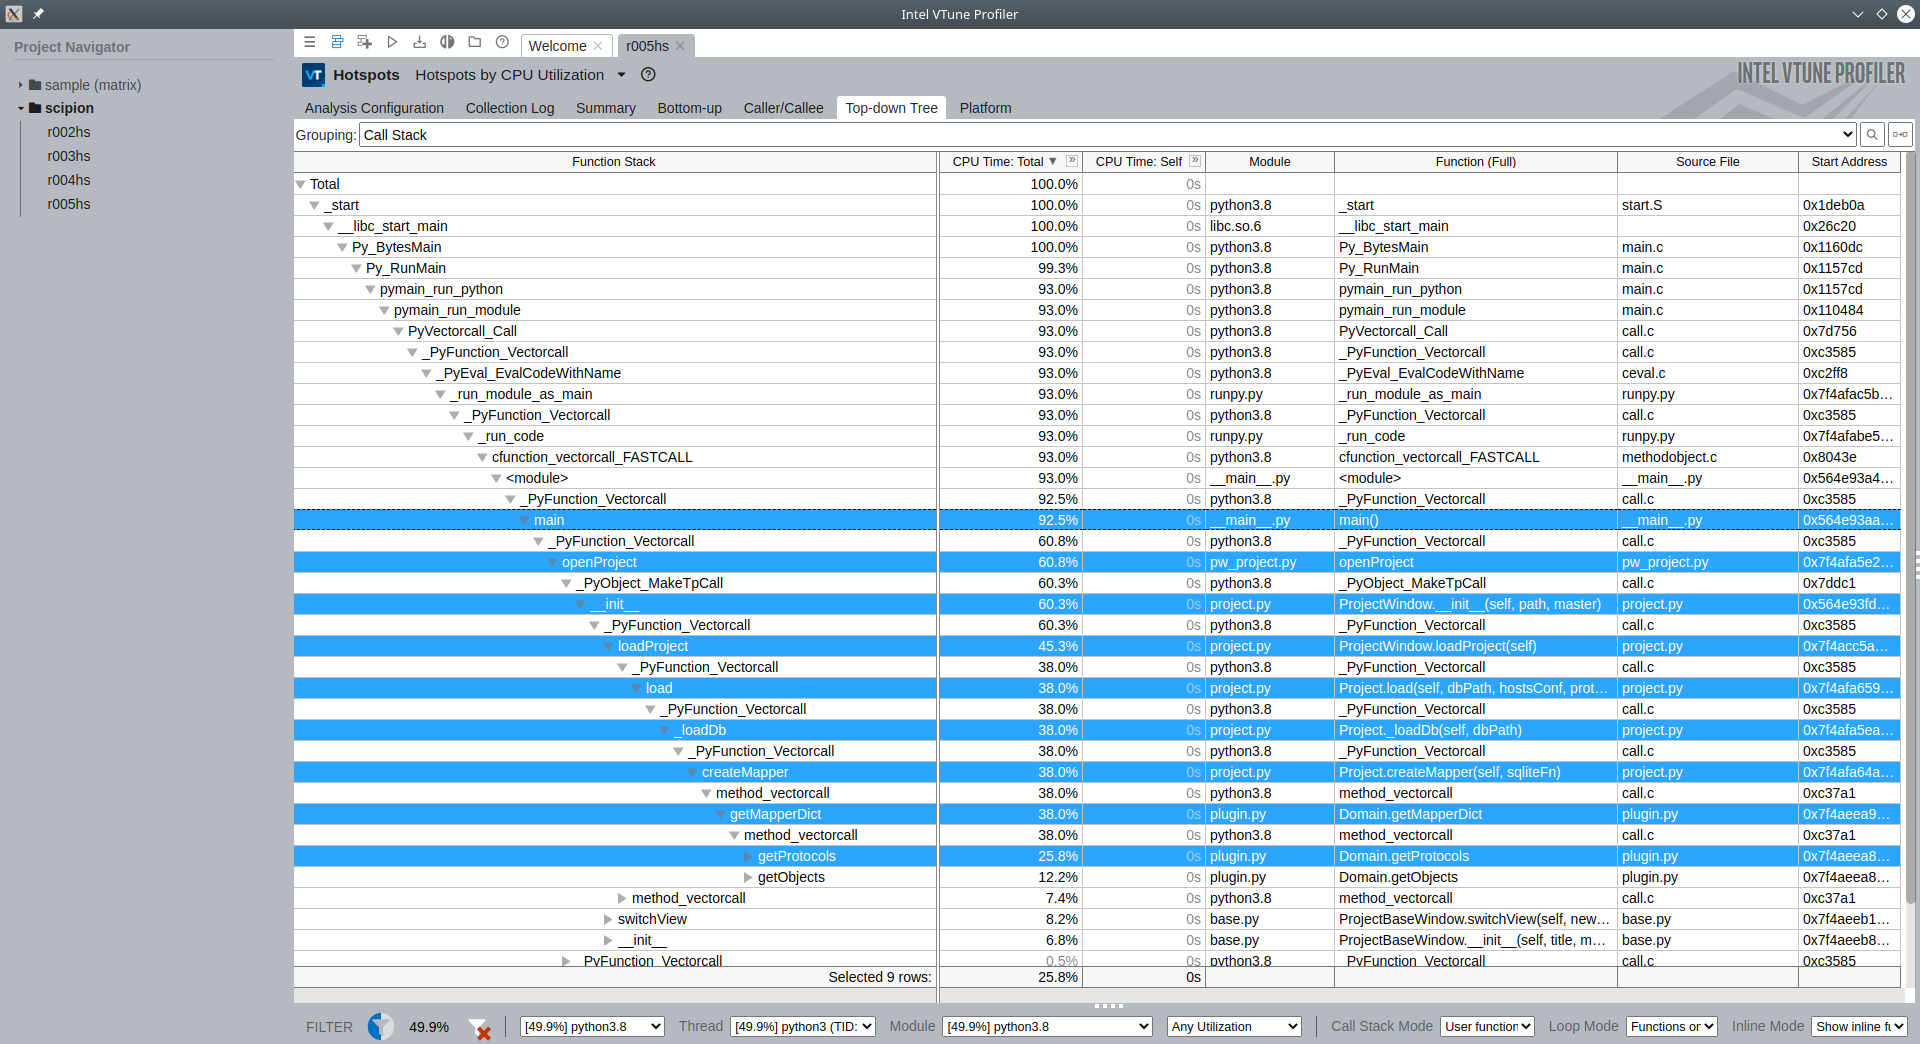
Select the main (most used) Python process, thread and module at the bottom and switch to Top-down Tree tab. Choose Grouping: Call Stack. Start unwrapping the list of functions. In the example below you can see how __main__.py from scipion-app launches a tree of functions:
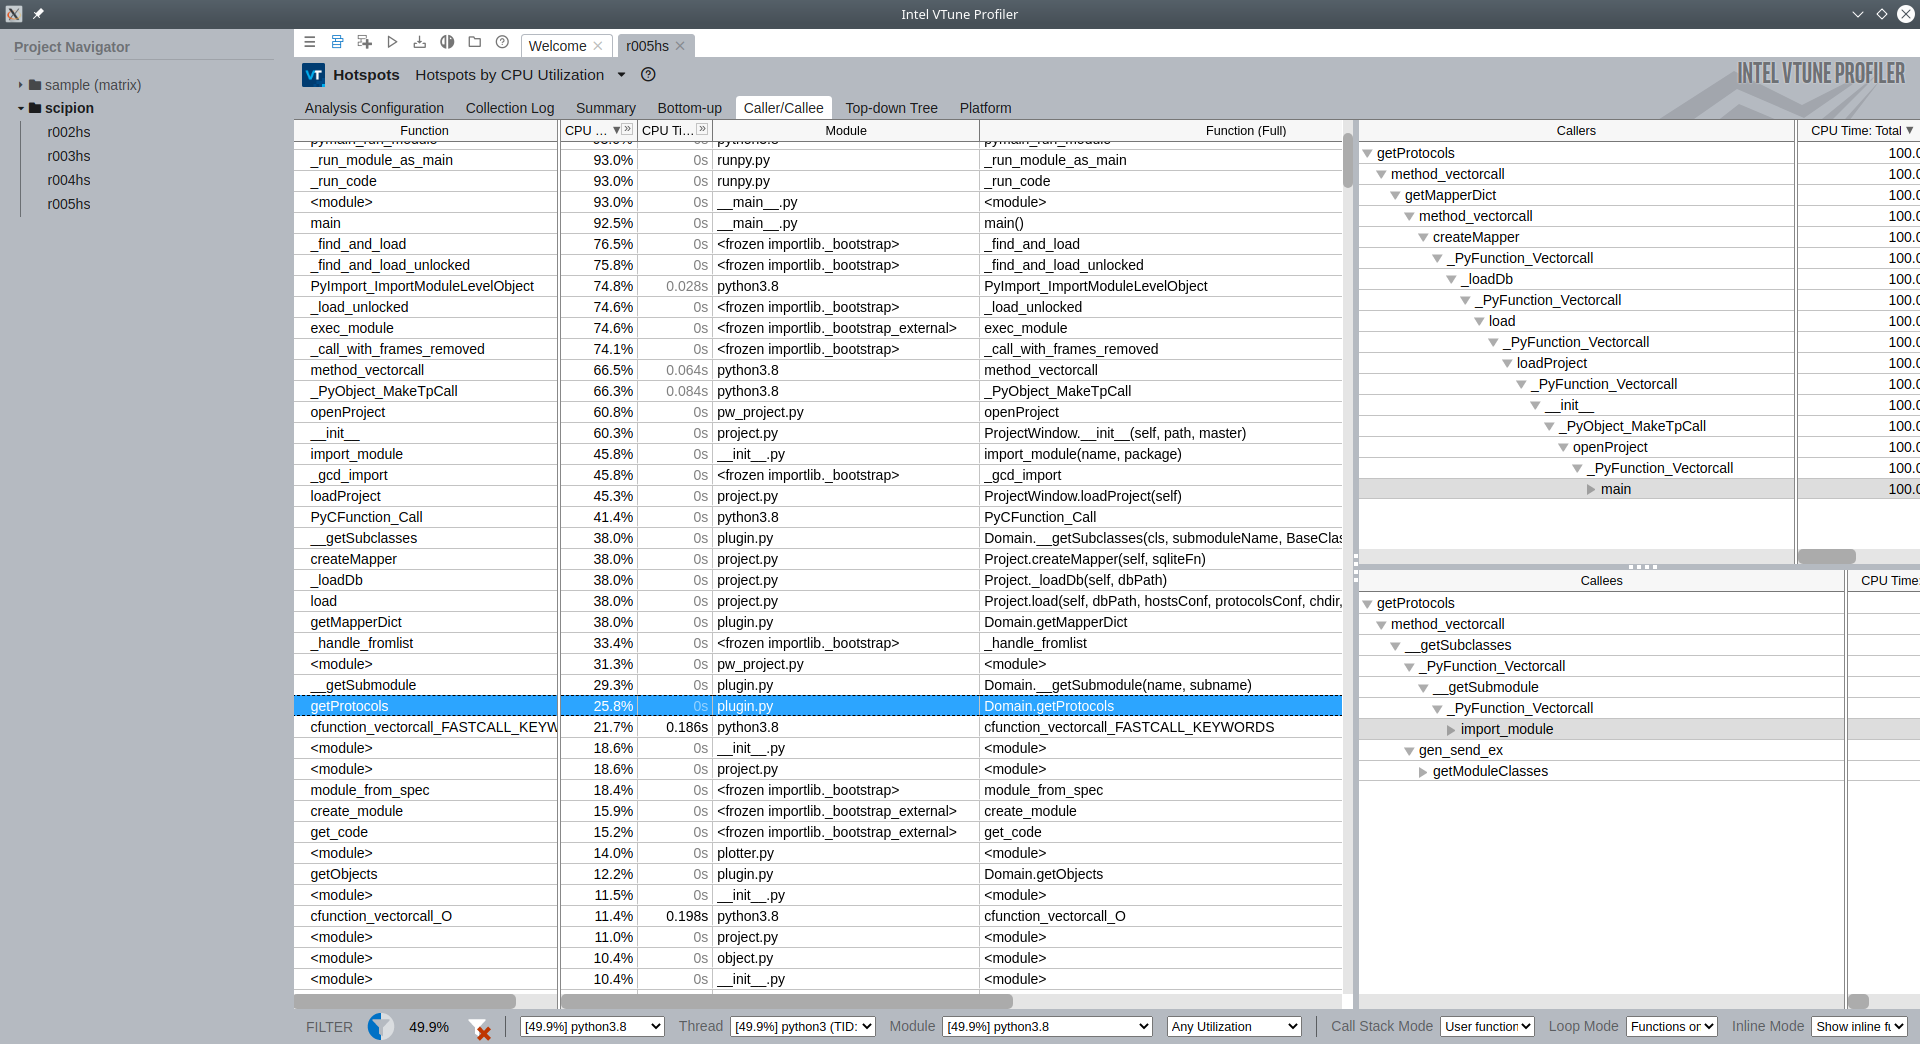
Another representation of results can be seen in Caller/Callee tab. Here you can display parent (Callers) and child (Callees) functions for every element. Example below is for Domain.getProtocols function from plugin.py:
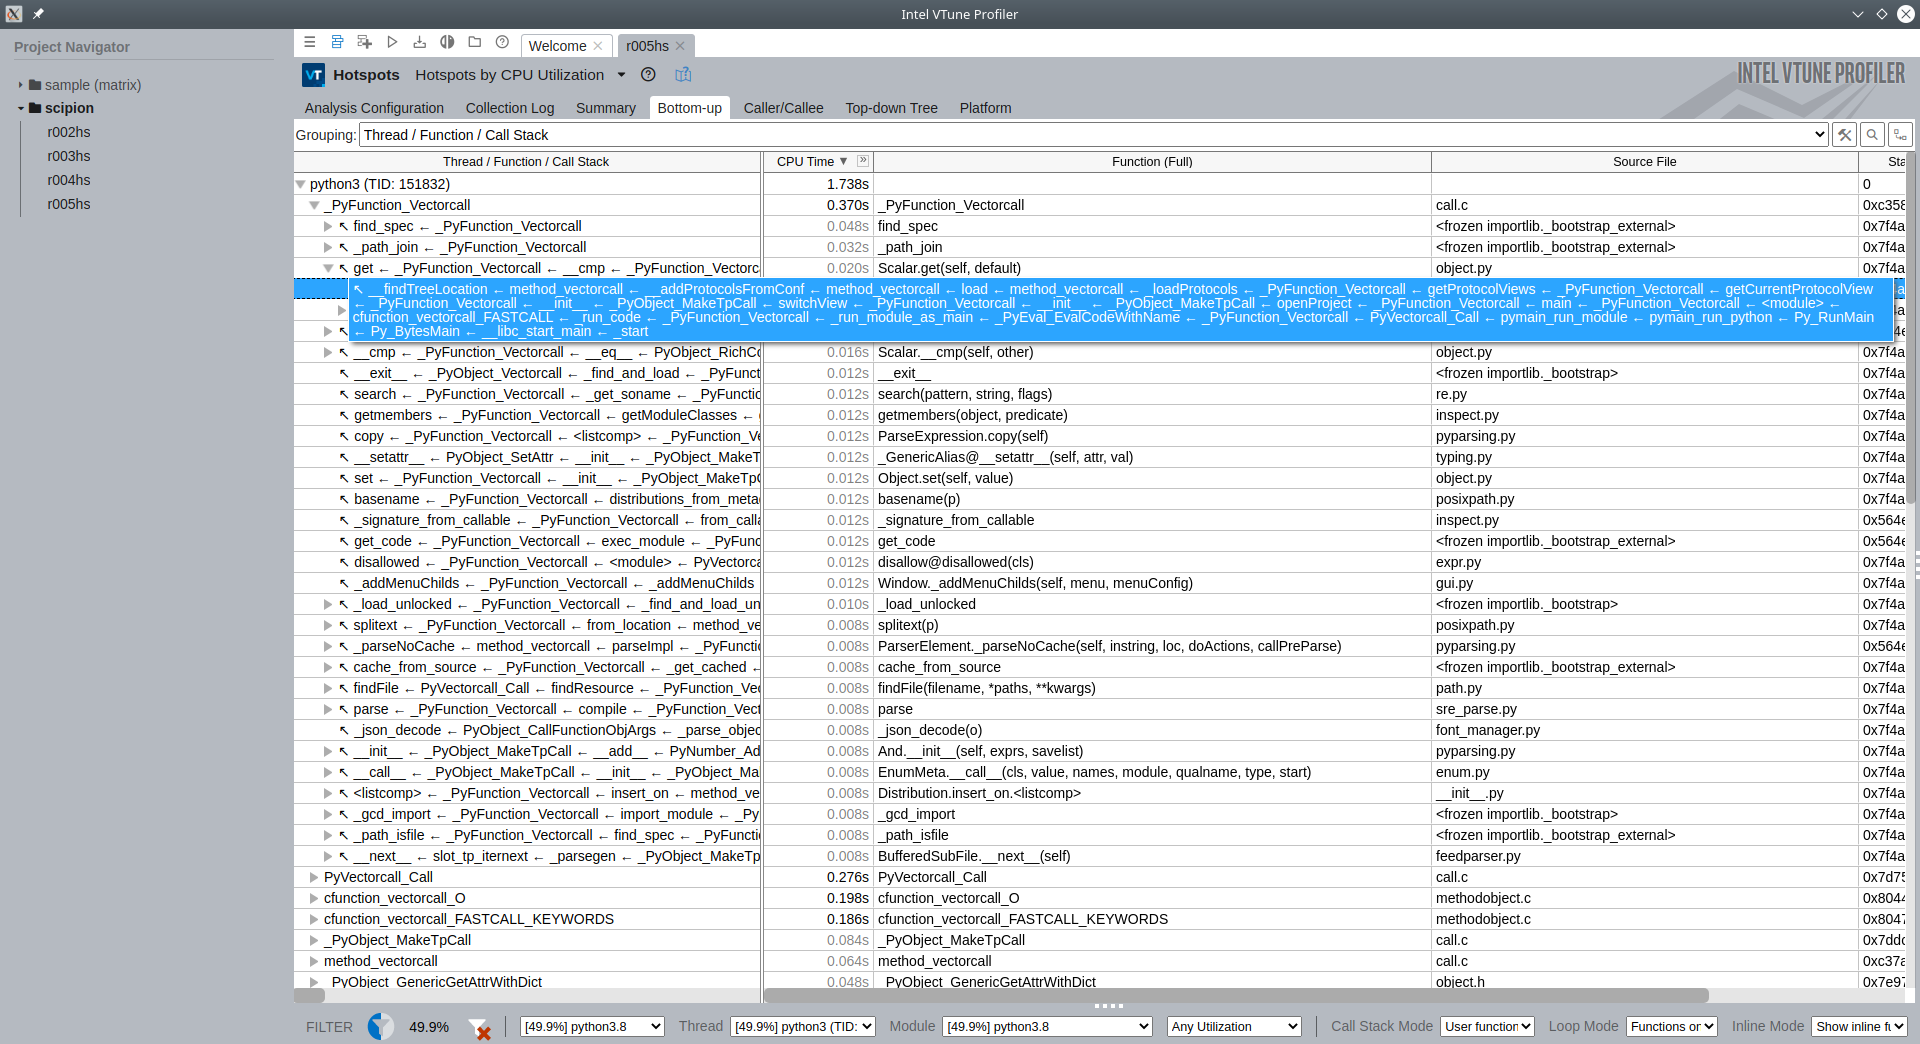
Go to Bottom-up tab and select Grouping: Thread/Function/Call stack. All calls are sorted by CPU time by default. Here every call can be traced down to a source code line. Here we are looking at __findTreeLocation function from viewprotocols.py:
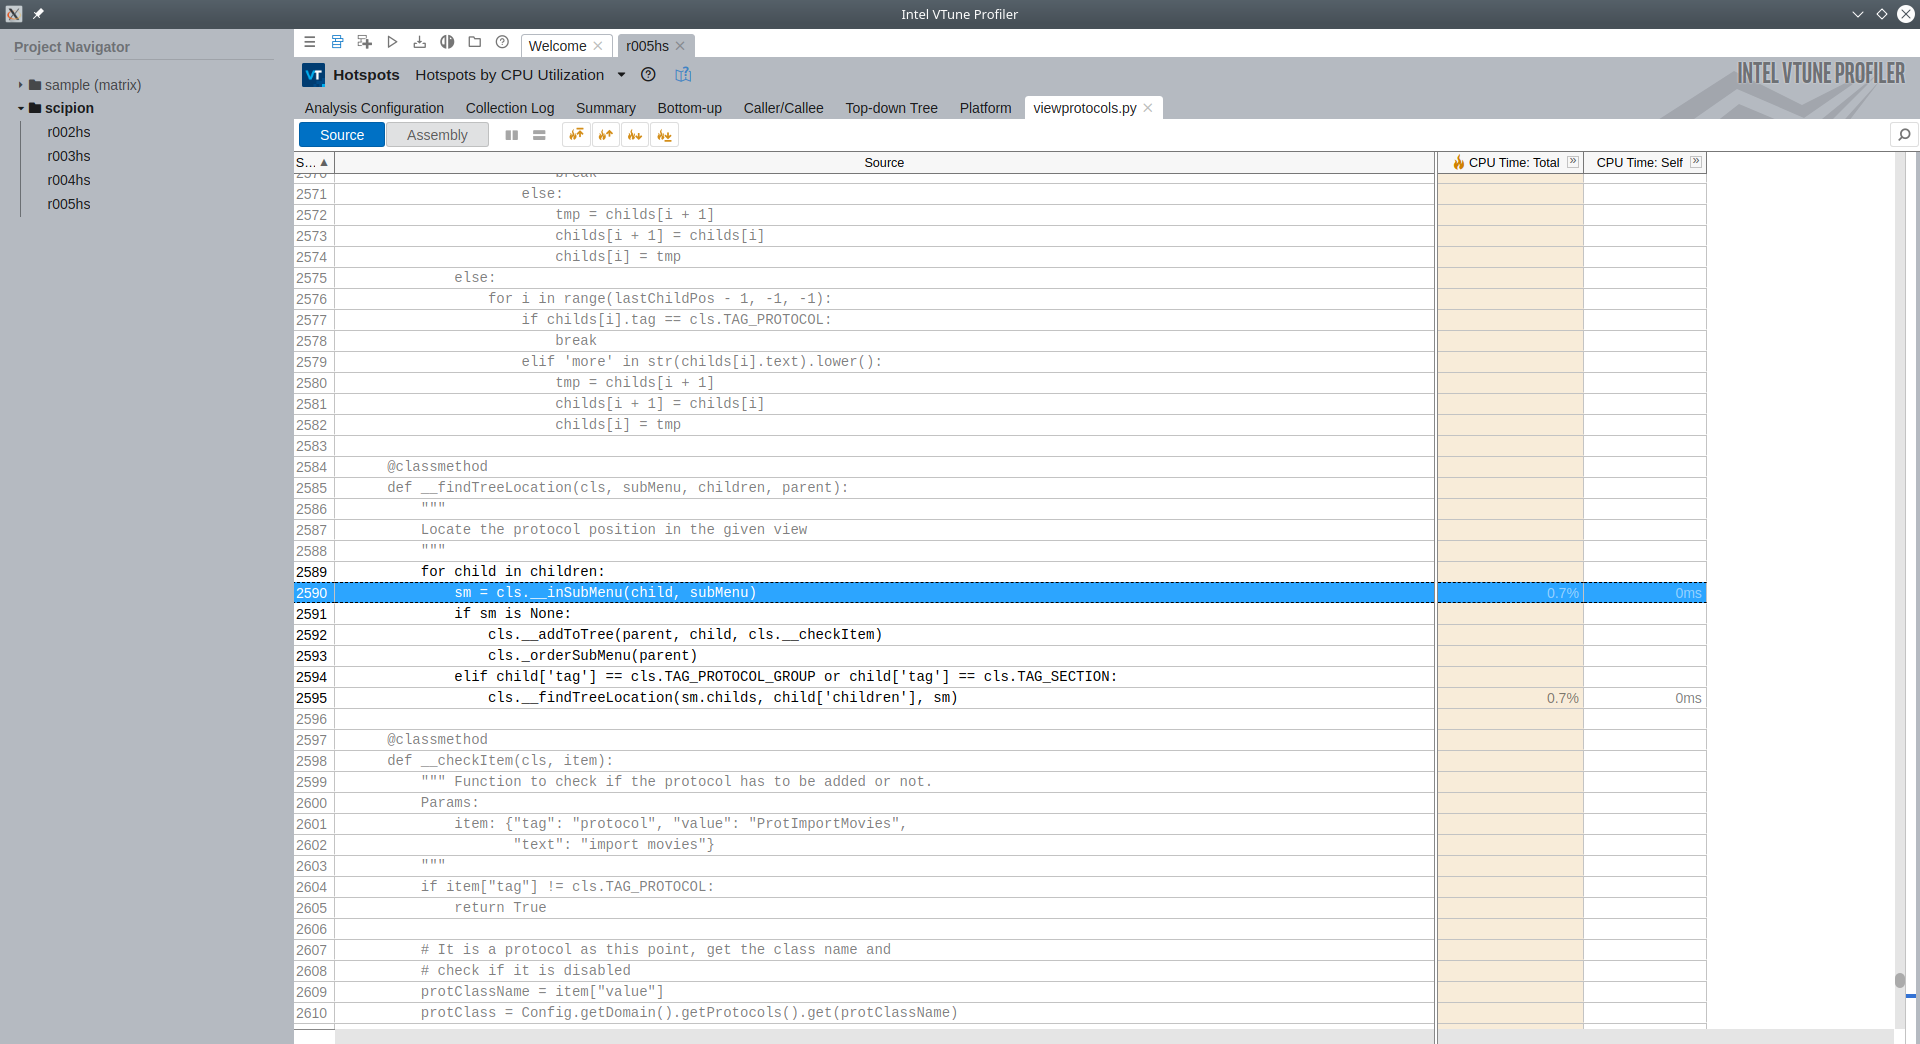
If you double click on any call VTune will try to open the source code file in a separate tab and point you to the exact line:
Summary
VTune provides different analysis types, for Python code you can choose the Hotspots, Threading, or Memory Consumption analysis type in the Configure Analysis tab. If you do want to attach to a running Python process (e.g. protocol execution), you can change Launch Application to Attach to Process and select the PID for the python process (like /path/to/pyworkflow/apps/pw_protocol_run.py /path/to/project/Runs/000353_EmpiarDownloader/logs/run.db 353).
Altogether now you should get familiar with the VTune software and get ready to profile a protocol run. The only difference is that the tree of processes, threads and functions will get more complex and also the time to run the analysis once you close Scipion will increase. We leave this exercise to the reader.