Debugging Scipion with PyCharm
Associated resources
Here you can find resources associated with this content, like videos or presentations used in courses:
Practice
We assume you have Scipion3 installed and PyCharm configured
We will learn how to add run configurations to skip scipion3 launcher and to be able to use PyCharm “debug” button straight away with many of the Scipion modes (tests, project, config, …) We will also learn how to attach to a “protocol process” to debug its steps.
Cloning and installing scipion-em-template
If you are following a course you might already have done this:
cd desired/location
git clone https://github.com/scipion-em/scipion-em-template.git
cd scipion3/location
./scipion3 installp -p scipion-em-template/location --devel
Checking out the empiar_download branch
Check out the empiar_download branch
git checkout empiar_download
Creating the debugging project
Open Scipion and create a new project called “debugging”.
Note
The name is not relevant but we’ll be referring to the project or folders associated using that name from now on.
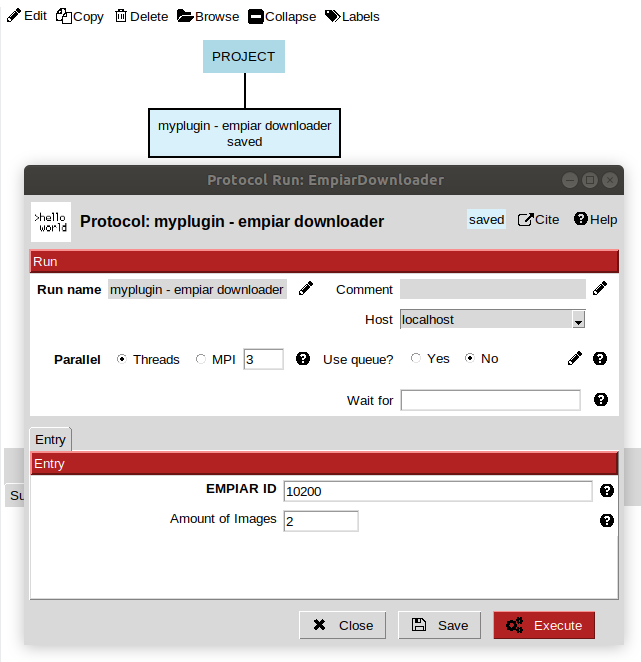
Find (Ctrl+F) the “myplugin - empiar downloader” protocol and save it. No need to execute it for now. You can close Scipion.
Skipping the scipion3 launcher in PyCharm configurations
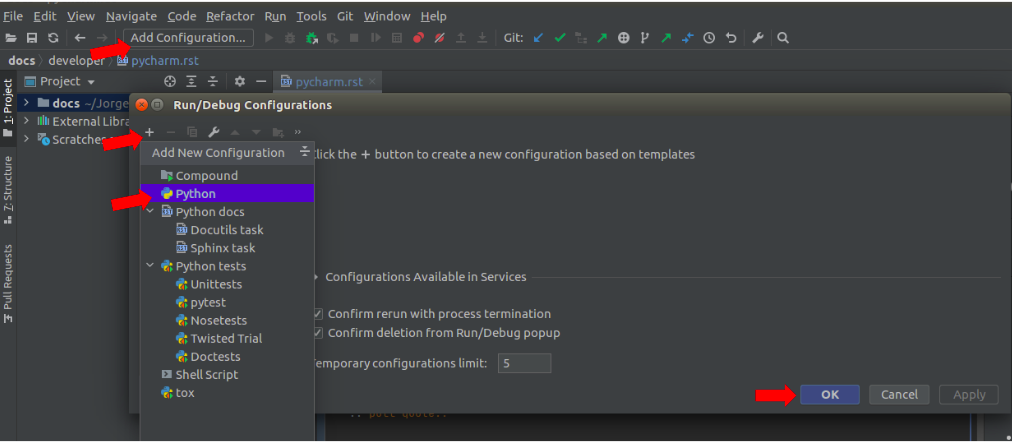
Add a new PyCharm configuration: it can be used to easily execute commands in one click. To create a new configuration, click on Add Configuration > + > python:
Set the values according to the image below
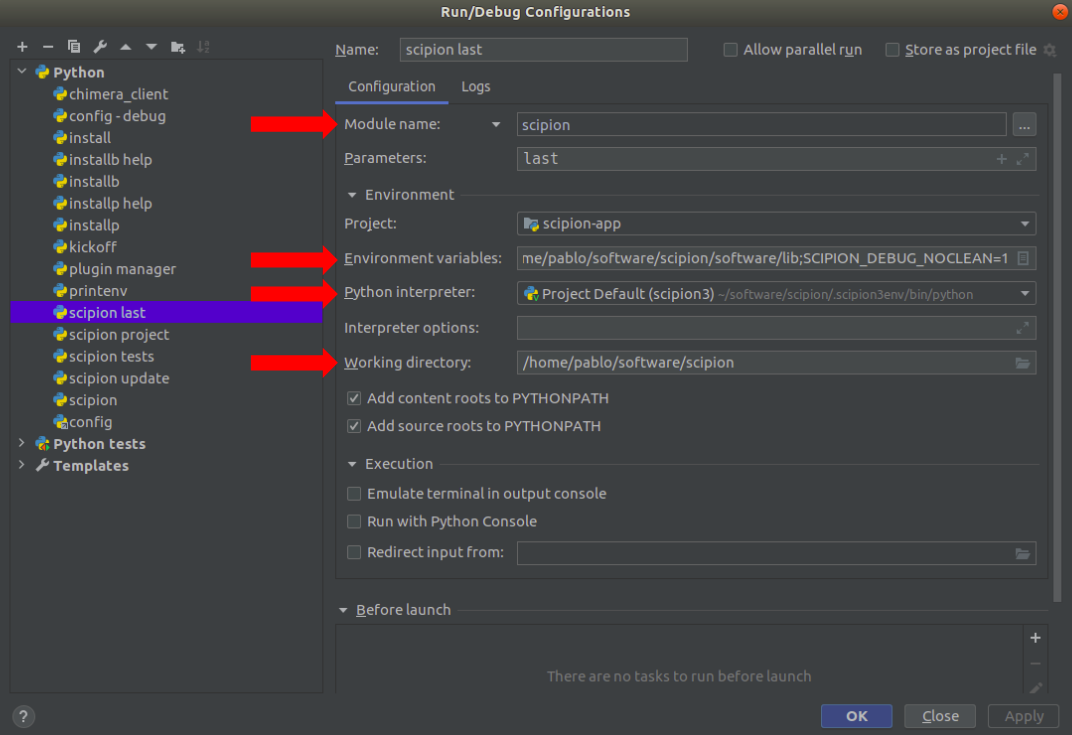
Name: scipion3 last.
Module name: Choose module name in the dropdown list instead of the script and then choose “scipion”
Parameters: enter “last”. This will open directly the last modified project.
Environment variables: You need to set 2 of them
SCIPION_HOME=/path/where/scipion/is/installed
LD_LIBRARY_PATH=/path/where/scipion/is/installed/software/lib
Python interpreter: /path/to/.scipion3env/bin/python
Working directory: same as SCIPION_HOME
“Apply” and you’ll have now a “direct” run/debug PyCharm configuration.
Tip
Duplicating this configuration and changing the “Parameters” field and “Name” will provide you more direct run configurations for other scipion modes like “tests”, “config”, … Type scipion3 help to discover them.
Testing the direct configuration
Set a breakpoint at scipion-app/scipion/__main__.py in the first import line by
clicking in the empty space between the line number and the import line. A red dot should appear
Click on the “Green bug” icon, or on Run>>Debug
PyCharm should stop execution at that breakpoint line.
Checkout this page to learn more about debugging in PyCharm.
Debugging the click on “Execute” button
Let’s debug what happens when you click on the “Execute” button in the protocol form.
Set a breakpoint in scipion-pyworkflow/pyworkflow/gui/form.py at FormWindow.execute
Don’t worry if you don’t understand all the code here.
Click on the debug icon. The last project should open (debugging project). Edit the saved protocol and click on the “Execute” button.
Try to understand:
How the protocol validation happens?
Tip
If you find hard to reach the protocol._validate method from the execute,
set a breakpoint in the myplugin/protocols/protocol_empiar_download at EmpiarDownloader._validate
and wait there.
Try to reach the point where the new process for the protocol is created (at
pyworkflow.protocol.launch._launchLocal)
Debugging the protocol execution
Protocol execution happens in a new process. There is no way to reach it using the “IDE debugging” configuration. For this you need to be able to attach to the protocol’s process. It is very likely that the executing code will be faster than you, clicking on the IDE menus to attach to the process. Thus, you need to “delay” the execution using sleep(10).
Delaying “TEMPORARILY” the protocol process
Go to pyworkflow.apps.py_protocol_run.py and add the TEMPORARY delay after the “if __main__” check:
if __name__ == '__main__':
    import time
    time.sleep(10)
    ...
This will give you some time.
Important
Do not forget to remove the time.sleep(10) when done or you’ll be delaying execution by 10 seconds
Now, edit the “empiar-downloader” protocol and execute it.
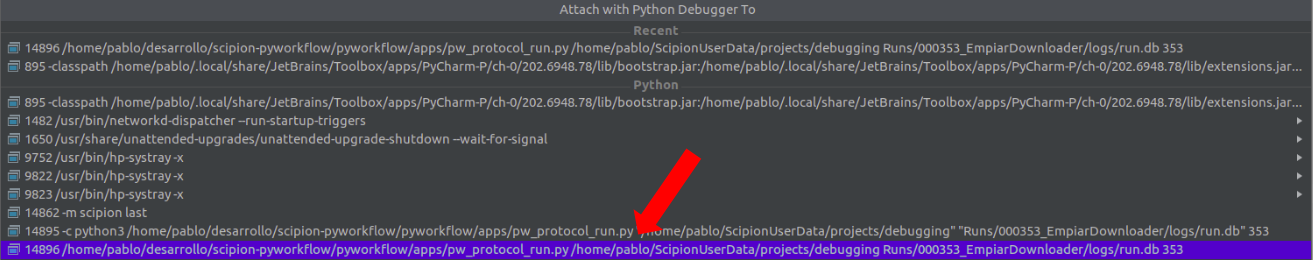
Go back to PyCharm and click on Run > Attach to process (a window should pop up with a list of python processes)
Look for the one like /path/to/pyworkflow/apps/pw_protocol_run.py /path/to/project/Runs/000353_EmpiarDownloader/logs/run.db 353
Other frequent debugging points to add the sleep to are _insertAllSteps, or a specific step method.